
Vietnamese company financial statements are four reports: balance sheet, income statement, cash flow statement and notes.
Most are prepared under Vietnamese Accounting Standards (VAS), not IFRS.
That matters for foreign investors, analysts and partner CFOs. The numbers look familiar, but formats and some rules differ.
This guide walks through each statement and the lines to check first.
It then analyzes a fictional company, Minh Phat JSC, in VND and ≈ USD.
Key takeaways
- A full set has four parts. The notes often hold the most useful detail.
- VAS relies more on historical cost and fixed templates than IFRS does.
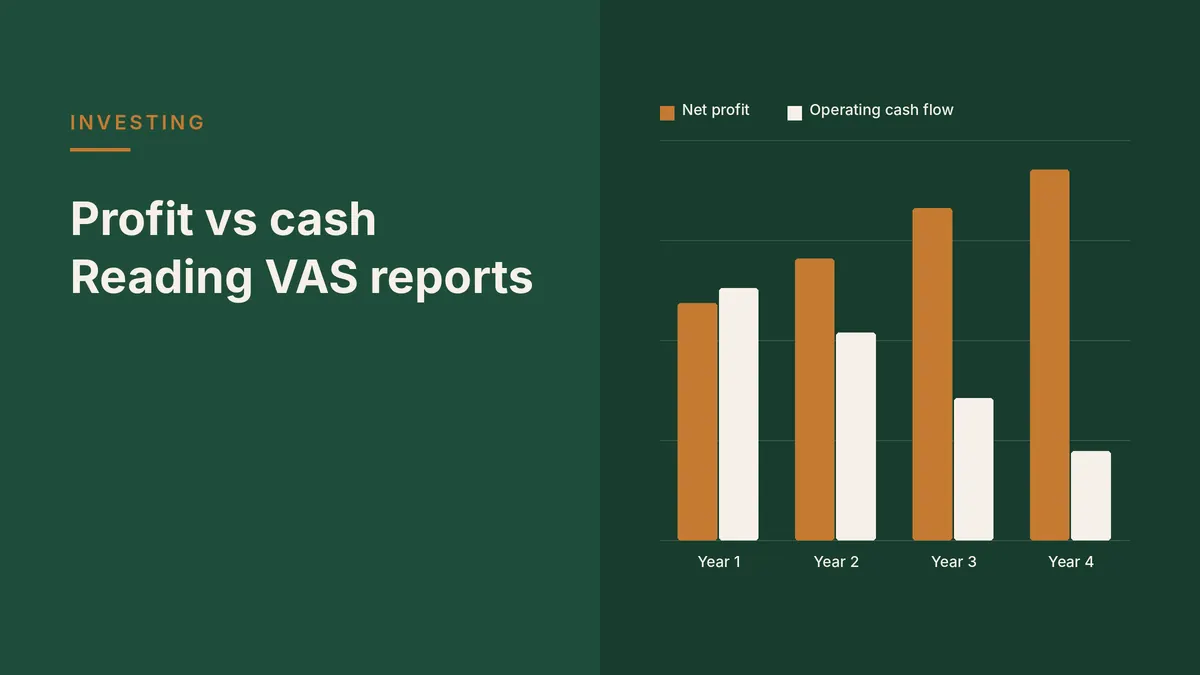
- Read operating cash flow next to net profit. A widening gap is a key warning.
- Common red flags: fast-growing receivables, large related-party balances and rising inventory.
- Compare years in VND first, then convert to USD at a stated rate.
What do a Vietnamese company’s financial statements include?
A complete set has four components. Each answers a different question, and none should be read alone.
- Balance sheet: what the company owns and owes at period end.
- Income statement: revenue, costs and profit, in a fixed sequence of numbered lines.
- Cash flow statement: cash in and out from operating, investing and financing activities.
- Notes: accounting policies, line breakdowns, related-party balances, borrowings and commitments.
Listed groups usually publish two versions: separate statements for the parent and consolidated statements for the group.
Investors should normally analyze the consolidated set.
The separate statements still help. They show how much cash and debt sit in the parent.
They also reveal whether parent profit depends on dividends from subsidiaries.
Annual statements are audited. Half-year statements are typically reviewed by the auditor.
Quarterly statements are usually unaudited, so treat quarterly figures as provisional.
How does Vietnamese Accounting Standards (VAS) reporting differ from IFRS for an investor?
VAS was modeled on older international standards, so the logic is broadly similar.
The differences sit in measurement, presentation and the depth of disclosure.
Measurement
VAS leans heavily on historical cost.
Assets that IFRS would remeasure, such as some investments, often stay at cost less provisions. Book values can drift.
Credit loss and inventory provisions often follow aging or fixed rules, not forward-looking models.
As a result, provisions can lag real deterioration.
Goodwill is generally amortized over time under VAS.
Under IFRS, goodwill is instead tested for impairment, which changes the profit pattern.
Presentation and disclosure
VAS prescribes standard templates and a national chart of accounts. Line names and codes are fixed.
That makes peers easy to compare but limits company-specific detail.
Disclosures on segments, financial instruments, leases and fair values are usually thinner than under IFRS.
Expect to dig into the notes and ask management more questions.
| Topic | Typical VAS practice | Typical IFRS practice |
|---|---|---|
| Asset values | Mostly historical cost | Wider use of fair value |
| Credit losses | Often aging-based provisions | Expected credit loss model |
| Goodwill | Generally amortized | Tested for impairment |
| Format | Fixed templates and line codes | Flexible, principle-based |
| Disclosure depth | Lighter | Broader and more detailed |
Some larger companies also publish IFRS statements for foreign shareholders.
When both exist, reconcile the two net profit figures and read the explanation of each difference.
Where do you find the statements, and in which language?
Listed companies publish statements on their investor relations pages and on the stock exchanges’ disclosure portals.
A Vietnam listed company annual report usually bundles the audited statements with management and governance sections.
Download the audited statements as a separate file when possible.
The Vietnamese version is the legally prepared original.
Many listed companies also publish English versions. These may appear later and be less complete.
If English and Vietnamese figures disagree, rely on the Vietnamese version.
Keep a short glossary of line names. The same fixed labels repeat across every company.
Always open the auditor’s report first.
A qualified opinion, disclaimer or “emphasis of matter” paragraph shows where to look most closely.
How do you read the income statement line by line?
The VAS income statement runs in a fixed order.
Learning it once is the core of how to read financial statements in Vietnam.
- Gross sales less deductions such as discounts and returns gives net revenue.
- Cost of goods sold gives gross profit. Track gross margin over several years.
- Financial income and financial expenses cover interest, exchange results and investment results.
- Selling and general and administrative expenses approximate operating overhead.
- Net operating profit, then other income and other expenses, often one-off items.
- Profit before tax, tax expense, then net profit after tax, split by owner group.
Note one key difference from many IFRS layouts.
VAS “net operating profit” includes financial income and expenses. It is not the same as operating profit.
To estimate core operating profit, subtract selling and administrative expenses from gross profit.
That strips out interest, exchange effects and investment gains.
Watch “other income” closely.
Asset disposal gains or compensation receipts can lift one year’s profit without improving the core business.
What should you check first on the balance sheet?
The VAS balance sheet lists short-term assets first, then long-term assets, liabilities and equity.
Start with the items that most often hide problems.
- Cash versus borrowings: compare cash and deposits with all loans to see net debt.
- Receivables: check trade receivables, supplier advances and “other receivables” separately.
- Inventory and provisions: compare inventory growth with revenue growth and check provisions.
- Construction in progress: projects that never become fixed assets can signal stalled investment.
- Advances from customers: healthy funding in project sectors, or a sign of delayed delivery.
Then read equity. Separate contributed capital, share premium and retained earnings.
Check whether retained earnings rely on profits that never became cash.
Why does the cash flow statement matter more than reported profit?
Profit depends on accounting estimates and timing. Cash does not.
Over several years, a healthy business turns most of its net profit into operating cash flow.
Most Vietnamese companies use the indirect method.
It starts from profit before tax and adjusts for non-cash items and working capital changes.
The working capital lines explain the gap.
Rising receivables and inventory absorb cash. Rising payables and customer advances release it.
Minh Phat JSC, our fictional building materials distributor, shows why this matters.
Its reported profit rises every year while its operating cash flow falls.
| VND billion | Year 1 | Year 2 | Year 3 | Year 4 |
|---|---|---|---|---|
| Net revenue | 1,000 | 1,150 | 1,320 | 1,450 |
| Net profit | 80 | 95 | 112 | 125 |
| Operating cash flow | 85 | 70 | 48 | 30 |
| Trade receivables | 150 | 210 | 300 | 400 |
| Inventory | 120 | 150 | 200 | 260 |
| Cash conversion (OCF ÷ net profit) | 1.06x | 0.74x | 0.43x | 0.24x |
Over four years, Minh Phat reports VND 412 billion of net profit.
Yet it generates only VND 233 billion of operating cash flow.
Year 4 net profit is VND 125 billion (≈ USD 5.0 million).
Year 4 operating cash flow is VND 30 billion (≈ USD 1.2 million), at 25,000 VND/USD (assumed).
Which ratios should you calculate?
A short, consistent set covers profitability, liquidity, leverage and efficiency.
Calculate them for at least three years, because direction matters more than one value.
Cash conversion = Operating cash flow ÷ Net profit
Receivable days = Trade receivables ÷ Net revenue × 365
ROE = Net profit ÷ Average equity
Minh Phat’s Year 4 net revenue is VND 1,450 billion. Cost of goods sold is VND 1,102 billion.
Selling plus administrative expenses total VND 160 billion.
Current assets are VND 820 billion, and current liabilities are VND 520 billion.
Borrowings are VND 420 billion. Equity is VND 700 billion, up from VND 620 billion.
| Ratio (Year 4) | Formula | Inputs, VND billion (≈ USD million) | Result |
|---|---|---|---|
| Gross margin | Gross profit ÷ Net revenue | 348 (13.9) ÷ 1,450 (58.0) | 24.0% |
| Core operating margin | (Gross profit − Selling and admin) ÷ Net revenue | 188 (7.5) ÷ 1,450 (58.0) | 13.0% |
| Net margin | Net profit ÷ Net revenue | 125 (5.0) ÷ 1,450 (58.0) | 8.6% |
| Current ratio | Current assets ÷ Current liabilities | 820 (32.8) ÷ 520 (20.8) | 1.58x |
| Debt-to-equity | Borrowings ÷ Equity | 420 (16.8) ÷ 700 (28.0) | 0.60x |
| ROE | Net profit ÷ Average equity | 125 (5.0) ÷ 660 (26.4) | 18.9% |
| Receivable days | Trade receivables ÷ Net revenue × 365 | 400 (16.0) ÷ 1,450 (58.0) | 100.7 days |
| Inventory days | Inventory ÷ Cost of goods sold × 365 | 260 (10.4) ÷ 1,102 (44.1) | 86.1 days |
| Cash conversion | Operating cash flow ÷ Net profit | 30 (1.2) ÷ 125 (5.0) | 0.24x |
USD figures use an assumed rate of 25,000 VND/USD.
Ratios are unaffected by the rate, because both inputs convert at the same rate.
Read together, the ratios tell a mixed story.
Margins, ROE and leverage look comfortable. Receivable days and cash conversion point to weak collection.
Receivable days rose from 54.8 in Year 1 to 100.7 in Year 4.
Customers now take about twice as long to pay as three years earlier.
Which red flags show up often?
Most problems in Vietnamese company financial statements appear first in working capital and related-party notes.
They usually show up long before profit falls.
Receivables growing faster than revenue
Minh Phat’s revenue grew 15.0%, 14.8% and 9.8% in Years 2 to 4.
Its trade receivables grew 40.0%, 42.9% and 33.3% over the same years.
That can mean looser credit terms, weaker customers, or revenue booked before it is earned.
Read the receivables aging and provision notes.
Related-party transactions
Group structures are common in Vietnam.
Many companies trade with shareholders, sister companies or entities linked to directors. That is not wrong in itself.
The risk lies in terms and size.
Check related-party sales, purchases, loans and “other receivables” in the notes.
Then ask whether prices reflect arm’s-length terms.
A large related-party loan, booked as short-term and rolled over every year, deserves particular scrutiny.
Inventory build-up
Minh Phat’s inventory rose 25.0%, 33.3% and 30.0% in Years 2 to 4, far ahead of revenue.
Inventory days reached 86.1 in Year 4.
Rising stock can reflect planned expansion. It can also hide slow-moving or obsolete goods.
Compare the inventory provision with the age of the stock.
Other warning signs
- Profit driven by financial income, asset sales or “other income” rather than gross profit.
- Frequent changes of auditor, or late publication of audited statements.
- Short-term borrowings funding long-term assets, which creates refinancing risk.
How do you compare figures across years and in USD?
Start in VND.
Judge performance in the currency the company trades in, before adding any exchange rate effect.
Check that prior-year figures have not been restated.
Restatements are disclosed in the notes and can change the trend you thought you saw.
Use compound annual growth for multi-year comparisons.
Minh Phat’s revenue grew from VND 1,000 billion to VND 1,450 billion, a compound annual 13.2%.
Then convert to USD with stated rates.
For illustration, assume 23,500 VND/USD in Year 1 and 25,000 VND/USD in Year 4.
These rates are not forecasts.
| Net revenue | Year 1 | Year 4 | Total growth | Annual growth |
|---|---|---|---|---|
| VND billion | 1,000 | 1,450 | 45.0% | 13.2% |
| Assumed VND/USD rate | 23,500 | 25,000 | – | – |
| ≈ USD million | 42.6 | 58.0 | 36.3% | 10.9% |
Here, a weaker VND cuts reported growth for a USD-based investor from 45.0% to 36.3%.
The business did not change; only the measuring unit did.
Use the year-end rate for balance sheet items.
Use an average rate for income and cash flow items. State the rates in every report.
For more on how macro conditions shape these numbers, see our overview of Vietnam’s key economic indicators.
Common mistakes
Most errors come from treating VAS statements as IFRS statements with different labels.
- Reading only the income statement: profit alone hides collection and inventory problems.
- Misreading “net operating profit”: under VAS it includes financial items, so recalculate.
- Skipping the notes: related-party balances, borrowings and provisions are explained there.
- Using the parent’s separate statements: consolidated statements usually show the whole group.
- Mixing currency and business effects: converting to USD first blurs real performance.
Frequently asked questions
Do Vietnamese listed companies report under IFRS?
Most report under VAS, the required framework for statutory statements.
Some larger companies also publish IFRS statements, mainly for foreign investors and lenders.
Is the English version of the statements reliable?
English versions are usually translations of the Vietnamese original.
They are helpful, but if figures differ, treat the Vietnamese version as authoritative.
What is a healthy cash conversion ratio?
There is no fixed benchmark; it varies by sector and growth stage.
Over several years, a ratio near 1.0x or higher is reassuring. A steady decline needs explaining.
How many years of statements should I analyze?
Aim for three to five years.
That shows trends in margins, working capital and cash conversion, and exposes one-off items.
Sources
- Use of IFRS Standards by jurisdiction: Vietnam – IFRS Foundation, 2016
- IAS 7 Statement of Cash Flows – IFRS Foundation (accessed Oct 2026)
- A comparison of IFRS and Vietnamese GAAP – PwC Vietnam, 2021
- Analyzing Statements of Cash Flows I – CFA Institute, 2026
- The World Bank and Vietnam Work to Strengthen Financial Systems – World Bank, 2017
- G20/OECD Principles of Corporate Governance 2023 – OECD, 2023
Read next
- How VND and USD currency risk affects your finances
- Corporate finance guides for managers in Vietnam
- More investing guides
This article is for general education, not financial, investment, legal or tax advice.
Minh Phat JSC, its figures and the VND/USD rates are illustrative assumptions.
 Earning in VND, Spending in USD: How to Manage Currency Risk in Your Personal Finances
 Vietnam’s Key Economic Indicators Explained: GDP, CPI, PMI and the Exchange Rate